Why Chasing Too Much Growth Destroys Returns (And Where to Look Instead)

December 10, 2025
2 min read

Sales growth is at the heart of every business. But not all growth is created equal. Too little, and the business stagnates. Too much, and volatility – and hype – punishes investors. The sweet spot? 7 to 20% revenue growth. That’s where compounding and discipline meet.
Sales growth.
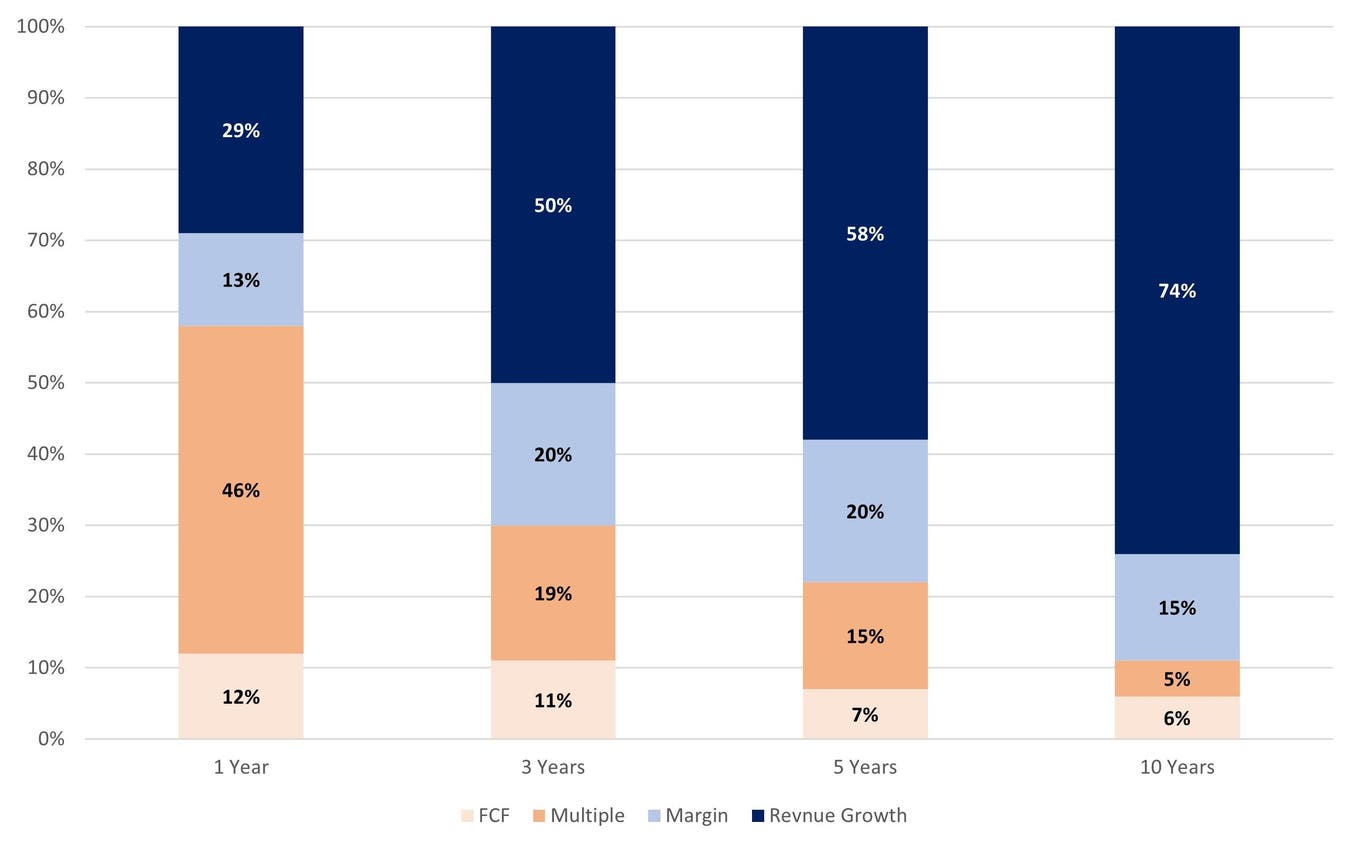
It is the most important value driver for companies (see chart 1 below).
But just as important – if not more – is the range of sales growth over long periods of time.
On the one hand, too little growth and both your business and your stock price will stagnate. Even worse, no one will pay attention. It becomes a company and a stock not worth writing home about, let alone a portfolio holding capable of outperforming.
On the other hand, too much growth will certainly attract investors, and your stock price will likely jump ahead of itself, pricing in a rosy future long before it arrives. That high-growth zone is exciting, full of great stories and the kind of narratives people love to tell. But history shows its caveats. High growth often comes with high volatility, bouts of excessive optimism followed inevitably by excessive pessimism, and the boom-and-bust cycles that make buy-and-hold a test of both conviction and patience.
And lurking beneath it all is the simple truth that no company can grow at a breakneck pace forever. Trees, after all, do not grow to the sky.
So, too little growth, and you can’t beat the market. Too much growth, and owning the stock through wild price swings becomes its own headache. What, then, is the range of sales growth that makes the most sense to focus on?
It’s the one with a floor of 7% and a ceiling of 20% revenue growth.
Below 7% is insufficient. Above 20% is unsustainable.
Chart 1: Sales Growth is Key Driver of Long-Term Stock Performance. Sources of Total Shareholder Return for Top-Quartile Performers, S&P 500 (1990 – 2009)